(vasep.com.vn) Pangasius exports to the EU markets continued to decline over the months, making the total exports to EU decreased by 7.8% (as of 15th September 2014) compared to the same period last year. Meanwhile, Spanish market had positive trend. With growth rate of 10% and the value of US$ 58 million (as of 15th September 2014), Spain is the leading consumption market for Vietnam pangasius among EU nations. Spain is accounted for 5% of Vietnam's total pangasius exports.
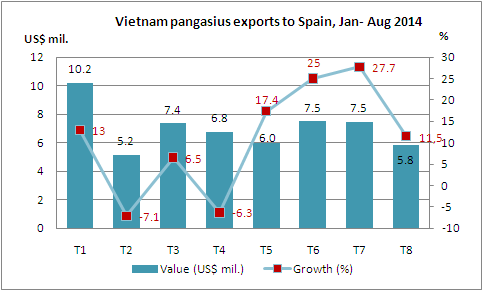
Vietnam’s Pangasius exports to Spain fell in February and April compared with the same months of last year. Other months were reported with positive growth rates, and dramatic increase in May, June and July.
Spain’s economic recovery increased household spending sharply. Higher demand for imports created favorable conditions for pangasius and other seafood products from Vietnam. In 1H 2014, Spain imported 713.5 thousand MT of seafood with total value of US$ 3.14 billion, up 8.9% yoy. Imports of fish (fillets or cut, fresh / chilled / frozen) HS code 0304 products reached 103 thousand MT, valued at US$ 419 million, up 11% in volume and 16% in value over the same period of 2013.
Vietnam is Spain’s second largest supplier of fish fillets (HS 0304), accounting for 11% of the market shares, after Namibia (with 19% of market shares). Frozen pangasius fillets is one of the most imported seafood by the market. The hake and pollock products are also the most consumed.
Frozen catfish and pangasius fillets are imported to Span from Vietnam, China and Intra-Europe. Upto 90% of these products are from Vietnam.
Approximately 40% of pangasius products are distributed through traditional wholesalers and agents; another 40% are sent to chain stores and 10% sold in major supermarkets.
The common type to be sold in Spain retail market is skinless and boneless frozen pangasius. Common sizes for pangasius products are 120 -170 gram/pc, 170 - 220 gram/pc and 220 gram/pc. A bag of defrosted portion pangasius has 1-5 fillet pieces. They can also packed in 500 gram bags or 200 – 400 gram boxes.
Mercamadrid, Mercabana and Mercavalencia are largest consumption markets in Spain, accounted for 34%,19.5% and 14.5%, respectively.
|
Top 10 fresh/chilled/frozen fish fillets suppliers to Spain in 2013-2014 (MT)
|
|
Sources
|
QI/2013
|
QII/2013
|
QIII/2013
|
QIV/2013
|
QI/2014
|
QII/2014
|
QI+QII/2014
|
Change (%)
|
|
World
|
44,134
|
48,343
|
48,709
|
46,972
|
48,444
|
54,252
|
102,696
|
11.1
|
|
Vietnam
|
8,795
|
9,535
|
8,638
|
6,924
|
9,321
|
9,926
|
19,247
|
5.0
|
|
Namibia
|
5,879
|
11,668
|
9,090
|
6,490
|
6,828
|
9,454
|
16,282
|
-7.2
|
|
China
|
7,027
|
5,014
|
6,768
|
5,462
|
7,545
|
7,214
|
14,759
|
22.6
|
|
US
|
3,315
|
2,757
|
2,744
|
4,329
|
4,819
|
5,019
|
9,838
|
62.0
|
|
Argentina
|
1,683
|
2,080
|
3,521
|
6,187
|
1,433
|
4,224
|
5,657
|
50.3
|
|
Netherlands
|
4,782
|
4,249
|
3,822
|
4,789
|
5,134
|
3,835
|
8,969
|
-0.7
|
|
Iceland
|
2,306
|
2,198
|
1,581
|
2,140
|
2,937
|
3,230
|
6,167
|
36.9
|
|
South Africa
|
1,291
|
889
|
1,256
|
1,708
|
1,123
|
1,871
|
2,994
|
37.3
|
|
Portugal
|
1,189
|
1,226
|
3,903
|
1,251
|
991
|
1,315
|
2,306
|
-4.5
|
|
Source: ITC
|
Le Hang