This is the presentation of Prof. Ola Flateen (Tromso University, Norway) in the Conference “Future perspective of fisheries and aquaculture” in the framework of Vietfish 2018
Norway and Vietnam: similarities and differences
Similarities: Size (length and area), Coastal area, Fishing and aquaculture nations
Differences: Population, Economy, GDP, Natural resources, Location – N in the North and Vn in the South - and this consequently creates different climate and weather conditions
HDI: N (0.944) – ranked 1st, Vn (0.638) ranked 121st
Transparency: N - 3rd in the world, Vn ranked 107th
Disputed sea areas and fishing rights?
Norway has settled, according to the Law of the sea, all EEZ disputes, including with Russia and EU.
Annual negotiations and share agreements on Total allowable catches (TACs) and other fishing issues.
The South of China Sea disputes are still unsettled? This creates competition between nations and de facto open access fisheries.
Fisheries Management and Governance
Vietnam: Open access, Small scale, Some high-liner/intra-marginal rent (IMR), but no resource rent
Norway: Regulated, Large scale, Some resource rent and IMR in capture fishing, and very high economic rent in aquaculture (ERA)
What is a (fishery) subsidy?
WTO: ”…(i) financial contributions (ii) by a government or public body (iii) that confer a benefit”, all three conditions must be met
Why harmful in fisheries?
- Incentives for increased output, endangering fish stocks and reducing potential long term resource rent and profit
- Trade distortion through provision of advantages for one exporting country (if underdeveloped stocks)
Fuel subsidies and environmental tax exemptions
Governmental financial transfers to the fishery sector are not necessarily subsidies, nor necessarily harmful – FAO/WTO/OECD reports (Example: Research versus Trawler)
Sumaila et al. (2010): Good, bad or ambiguous (ugly) subsidies
Fishery subsidies and profitability effects
Short run (2 years) effects fuel subsidies:
Profitability when the Government’s subsidy action takes place is greater than profitability without this action.
The increased profitability of the vessels is a result of both revenue-enhancing and cost-reducing subsidy schemes
More benefits for the owners than for the crewmembers.
Positive impacts on the OCF of large vessels but negative effects on their IMR, while the positive effects on the rent of small vessels.
Key findings of Thuy et al., 2018
In Vietnam, offshore vessels are profitable even without subsidies
Higher education, more experience and type of fishing gear decide the likelihood of vessel owners taking part in the subsidy program
Remaining questions outside the scope of this project: What are the long term effects for fish stocks and harvest?
Subsidies and politics
Finley (2017) argues that much of the overcapacity that built up in the decades after World War II came about because of government subsidies, and that these subsidies largely were instruments in Cold War politics.
On high seas fishing subsidies:
Our results suggest that fishing at the current scale is enabled by large government subsidies, without which as much as 54% of the present high-seas fishing grounds would be unprofitable at current fishing rates (Sala et al., 2018).
Dear participants, do you think such arguments play a role today for countries like China in the South of China Sea?
The world total fish production increases due to aquaculture

Aquaculture production 2015, in quantity (thousand tonnes) and value (million USD), as well as the average annual change in the period 1985–2015. 74 countries ranked according to value
(Sources: see Flaaten 2018 Ch.11)
|
Rank
|
Country
|
Production
|
Average annual change (%)
|
| |
|
Quantity
|
Value
|
iqty
|
ival
|
|
1
|
China
|
60166.82
|
77412.90
|
8.87
|
10.42
|
|
2
|
India
|
5061.02
|
10612.68
|
7.09
|
10.05
|
|
3
|
Indonesia
|
15012.30
|
9670.64
|
12.58
|
11.29
|
|
4
|
Chile
|
1142.55
|
8586.29
|
16.52
|
22.86
|
|
5
|
Viet Nam
|
3402.27
|
8207.86
|
11.03
|
12.72
|
|
6
|
Norway
|
1356.69
|
6441.34
|
12.70
|
12.44
|
Cost structure of three aquaculture industries, at farm gate
|
Cost item
|
Pangasius, Vietnam3, 2016
|
White leg shrimp Vietnam3, 2014
|
Salmon Norway, 2016
|
|
Cost shares %
|
Cost shares %
|
Cost shares %
|
|
Smolt/seed
|
10.4
|
11.88
|
9.39
|
|
Feed
|
81.84
|
41.17
|
42.97
|
|
Labour1
|
1.08
|
4.91
|
6.73
|
|
Insurance
|
|
|
0.38
|
|
Pond rental
|
1.05
|
|
|
|
Power
|
|
11.68
|
|
|
Other operating cost
|
3.474
|
13.065
|
25.722
|
|
Depreciation
|
0.45
|
17.306
|
5.32
|
|
Net financial cost
|
1.16
|
-7
|
-0.12
|
|
Operating cost, all
|
99.44
|
100
|
90.4
|
|
Slaughter
|
0.56
|
-8
|
9.63
|
|
Total cost
|
100
|
100
|
100
|
Additional info on Cost structure of three aquaculture industries. Cost and revenue per kg fish at farm gate
Table notes:
May include some management cost
Includes repair, maintenance, administration, fish health, energy, and environmental measures
Dong Thap province and South Central Vietnam for pangasius and shrimp, respectively
Includes Chemicals/pharmacy, power, pond regeneration and materials
Pond regeneration is partly included in Labour
Includes maintenance and other fixed cost
Net financial cost is very small. Some may have been included in Other
The buyer usually harvest the shrimp and carry the cost (some cost to the farmer could be included in Labour)
Three aquaculture industries, cost and revenue per kg fish at farm gate (Sources: see Flaaten, 2018 Ch.11)
|
Items
|
Pangasius, Vietnam3, 2016
|
White leg shrimp Vietnam3, 2014
|
Salmon Norway, 2016
|
|
Total cost, national currency
|
21 440.00
|
108 832.40
|
33.86
|
|
Revenue, national currency
|
22 600.00
|
120 336.06
|
50.59
|
|
Profit
|
1 160.00
|
11503.66
|
16.73
|
|
Exchange rate, per USD
|
22 368.25
|
21 193.08
|
8.4
|
|
Total cost, USD
|
0.96
|
5.14
|
4.03
|
|
Revenue, USD
|
1.01
|
5.68
|
6.02
|
|
Profit margin
|
5.1
|
9.5
|
33.1
|
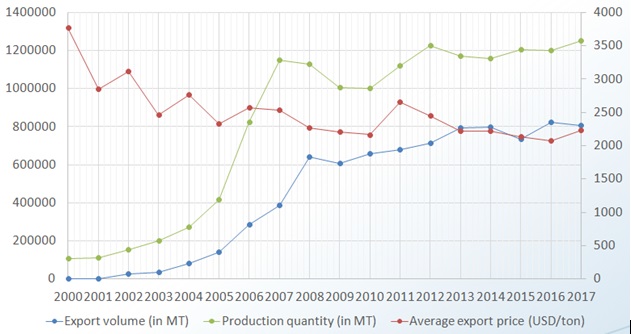
Pangasius production and export, Vietnam 2000-2017
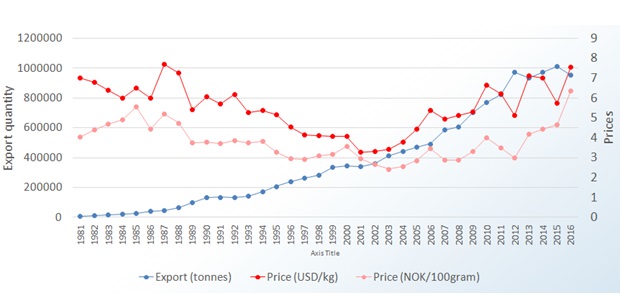
Atlantic salmon export, Norway 1981-2016
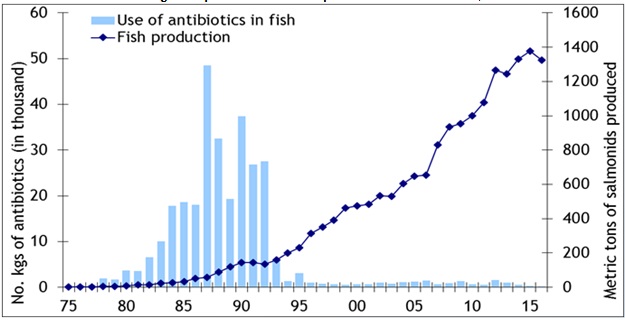
Antibiotics used in Norwegian aquaculture and the production of salmonids, 1975-2016
The tradeoff between wild and farmed salmon
Wild salmon: Used to be additional income for small scale fishermen; Now, mainly recreational fishing. Use and non-use values
Aquaculture production: Huge export value; Salmon lice, surplus feed, feces and escapees are the main externalities, including effects on wild fish
Economic rent in aquaculture (ERA)
Economic rent in aquaculture (ERA) is any payment to a farm and site owner, on land or sea, in excess of the costs needed to bring that farm into production. For analytic and policy purposes it may be useful to distinguish among different types of ERA, including oligopoly rent from access regulation (licensing) and hampered output
Atlantic salmon (Salmo salar) in Norway and white leg shrimp (Litopenaeus vannamei) in Vietnam, two successful aquaculture cases.
Analyses indicate very high profit and ERA rates in the Norwegian salmon industry and positive, but lower rates in the Vietnamese white leg shrimp farming.
Aquaculture rent (ERA) can be calculated from costs and earnings data. Concepts, and Norway 2016
|
Concept
|
Explanation
|
ERA for salmon and trout in Norway, 2016 Million NOK (million USD)
|
|
Revenue
|
Farm gate value of sale of fish.
|
50,072.31
(5,961.0)
|
|
- Total operating expenses
|
Including depreciation of farm, license and permit.
|
32,035.0
|
|
= Operating profit (EBIT)
|
Earnings before interest and tax.
|
18,037.3
|
|
+ Total financial revenue
|
Financial income and currency gains.
|
530.7
|
|
- Total financial expenses
|
Financial cost and currency rate losses.
|
495.4
|
|
= Profit on ordinary activities before tax (EBT)
|
|
18,072.6
|
|
+ Depreciation on intangible capital
|
Intangible capital includes licenses and permits.
|
-12.52
|
|
+ Financial cost of intangible capital
|
Financial cost (interests, fees) of license and permit purchases.
|
226.53
|
|
- Calculated interest on equity
|
Equal to what is paid on long term loans, or government bonds (opportunity cost).
|
917.63
|
|
= Economic rent in aquaculture (ERA) unadjusted
|
The residual for the aquaculture industry owners, without deduction of environmental and management cost.
|
17,369.0
(2,067.7)
|
|
Economic rent per kg
|
ERA divided by quantity sold at farm gate – per kg
|
18.22
(2.17)
|
|
Operating margin
|
EBIT in percent of revenue
|
36.0
|
|
Profit margin4
|
EBT in percent of revenue
|
36.1
|
|
Economic rent margin
|
ERA in percent of revenue
|
34.7
|
Aquaculture rent (ERA) can be calculated from costs and earnings data. Concepts.
|
Concept
|
Explanation
|
|
Revenue
|
Farm gate value of sale of fish.
|
|
- Total operating expenses
|
Including depreciation of farm, license and permit.
|
|
= Operating profit (EBIT)
|
Earnings before interest and tax.
|
|
+ Total financial revenue
|
Financial income and currency gains.
|
|
- Total financial expenses
|
Financial cost and currency rate losses.
|
|
= Profit on ordinary activities before tax (EBT)
|
|
|
+ Depreciation on intangible capital
|
Intangible capital includes licenses and permits.
|
|
+ Financial cost of intangible capital
|
Financial cost (interests, fees) of license and permit purchases.
|
|
- Calculated interest on equity
|
Equal to what is paid on long term loans, or government bonds (opportunity cost).
|
Aquaculture rent (ERA) can be calculated from costs and earnings data. Concepts and Norway 2016
|
= Economic rent in aquaculture (ERA) unadjusted (USD)
|
The residual for the aquaculture industry owners, without deduction of environmental and management cost.
|
17,369.0
(2,067.7)
|
|
Economic rent per kg (USD)
|
ERA divided by quantity sold at farm gate – per kg
|
18.22 (2.17)
|
|
Operating margin
|
EBIT in percent of revenue
|
36.0
|
|
Profit margin4
|
EBT in percent of revenue
|
36.1
|
|
Economic rent margin
|
ERA in percent of revenue
|
34.7
|
Aquaculture rent (ERA) for salmon in Norway and white leg shrimp in Vietnam
|
|
|
Norway-salmon,
2016
|
Vietnam-white leg shrimp 2014 (4 provinc)
|
|
= Economic rent in aquaculture (ERA) unadjusted
|
The residual for the aquaculture industry owners, without deduction of environmental and management cost.
|
mill. NOK 17,369.0
(mill. USD) (2,067.7)
|
mill. VND 1,492,106.3
(mill. USD) (69.8)
|
|
Profit margin4
|
EBT in percent of revenue
|
36.1
|
9.6
|
|
Economic rent margin
|
ERA in percent of revenue
|
34.7
|
7.2
|
Lessons learned (fisheries and aquaculture)
From the Law of the Sea – establish internationally agreed national rights and obligations in previous disputed seas, and then avoid domestic rent dissipating competition.
Get rid of national capacity and effort expanding government financial transfers (GFT) (Bad subsidies)
GFT to for example infrastructure, safety measures, social security, as well as to monitoring, control and surveillance can be Good subsidies
User and property rights in aquaculture
Environmental control (feed and medicine remains, disease, escapee…)
Food safety
Utilise branding (VASEP, Norwegian Seafood Council) and market power
The presentation of Prof. Ola Flateen (Tromso University, Norway) in the framework of Vietfish 2018